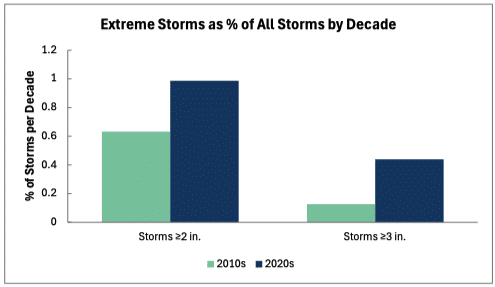
If you have lived in the Lowcountry during the hot summer months, you know that weather – especially rain – is HIGHLY variable from place to place. It’s not unusual to observe a deluge across the Sound and not see a drop where you are standing. That’s the result of hot summer temperatures, high humidity, variable water temperatures, sea breezes coming in from the Atlantic Ocean, and the topography of the Lowcountry. But these microbursts are becoming more intense as global climate patterns change. Here in the Lowcountry, our average yearly rainfall has remained consistent, but the distribution of precipitation has changed. Intense storms (≥3”) have roughly doubled in the 2020s compared to even just 10 years ago, and drizzle is becoming less common.
Getting accurate hyperlocal weather data is challenging—small rain cells vary significantly over short distances, affecting stormwater management, flooding, and water quality monitoring. Big microbursts of rain or ‘rain bombs’ have an impact on the Port Royal Sound because large volumes of freshwater dump into the system, washing all sorts of pollutants off the ground with it.
Tempest Weather Station Network
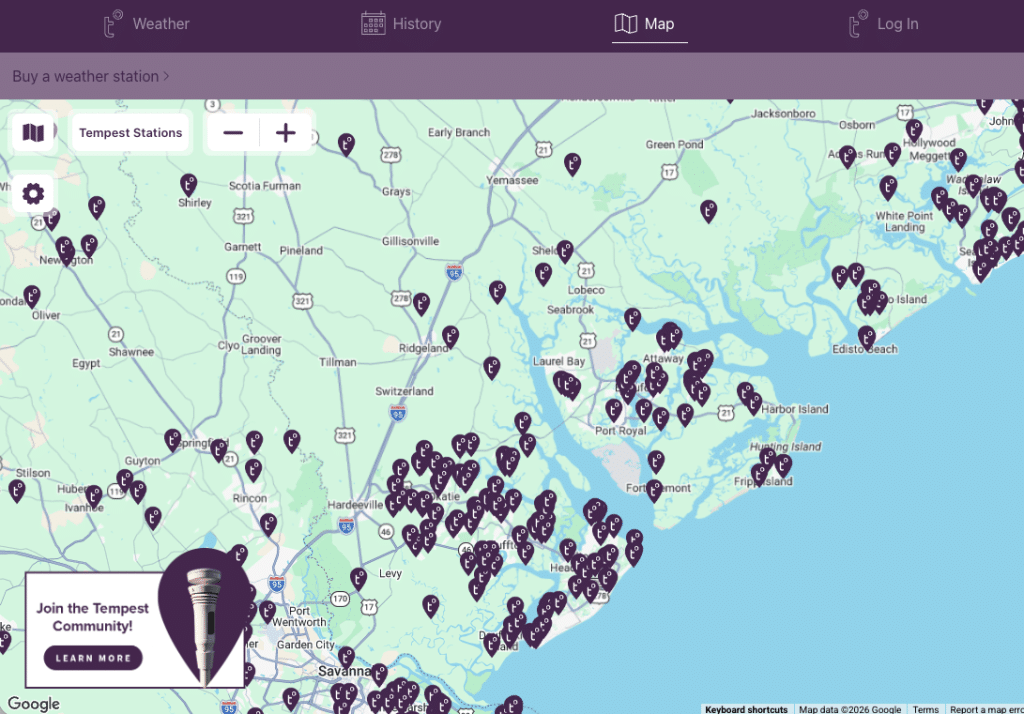
To get more accurate rainfall data and incorporate it into our water quality monitoring program, PRSF is working with our partners at Mērak Labs to collect real-time precipitation and weather data from the numerous Tempest stations already running across the region. Tempest is a relatively accessible and accurate, commercially available weather station that sends readings to the cloud every minute, so you can imagine the amount of data a network with hundreds of these stations can provide!
Hyper Local Precipitation Patterns
As an initial exploration of geographic rainfall disparities, we pulled rainfall data for June & July 2026 for five stations (map below) across the watershed to compare rainfall differences on any given day — essentially graphing the difference in rainfall from the same storms in the region. A good illustration of the difference in rainfall across the region is on July 13. You can see that all five locations saw rainfall, but the Beaufort City location received significantly more rainfall than the other locations. Likewise, on July 27, Okatie (the PRSF tower) received much more than Sheldon, and the other locations saw minimal rainfall.

Using Precipitation Data
Tempest weather data is now syncing directly into our water quality database to provide more accurate precipitation data for contextualizing data analysis. We have essentially told the system to pull from the closest station or to take the average of the three closest stations when no station is immediately nearby.
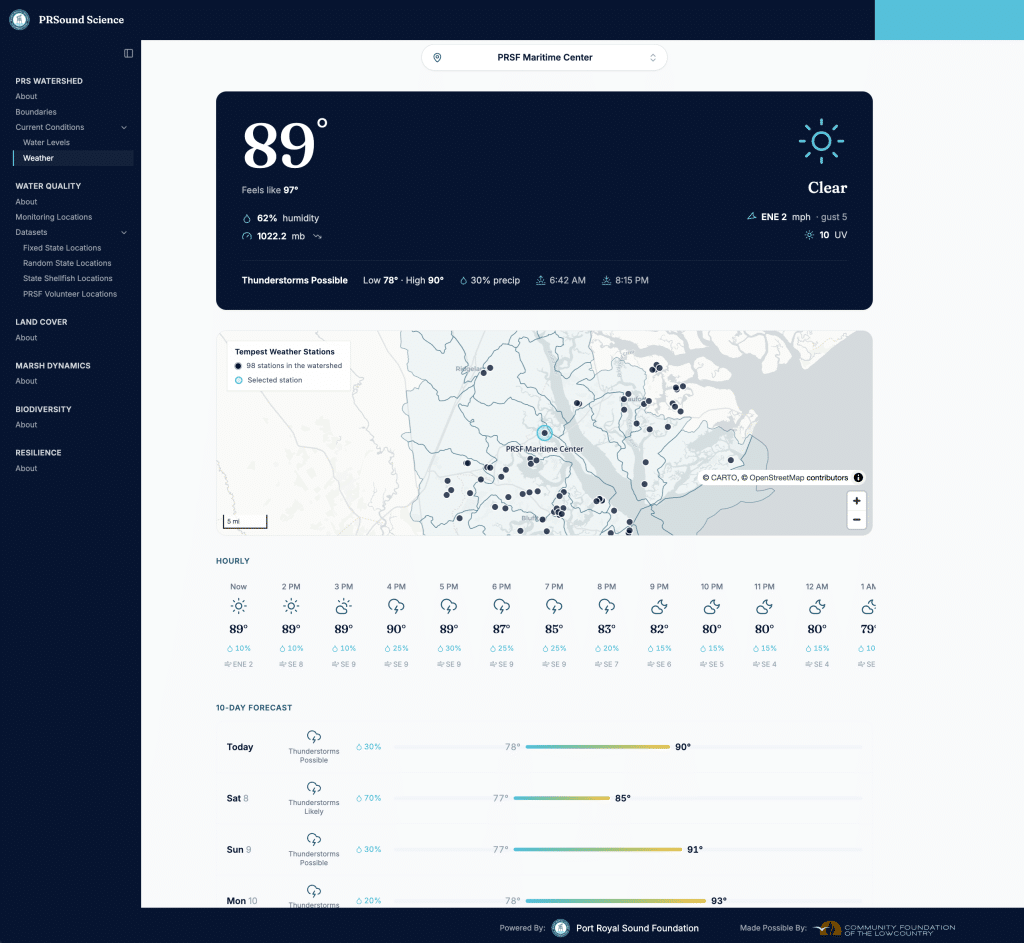
We also installed a Tempest station at the Maritime Center tower in May, so YOU can access live weather data and predictions from the Maritime Center (or any station really!) by clicking on the Weather option under Local Conditions at https://prsoundscience.org/watershed/weather